KPI charts
KPI is an acronym for key performance indicator. KPIs on orders (work orders or PPM orders) are used to measure the effectiveness of a service in achieving its objective.
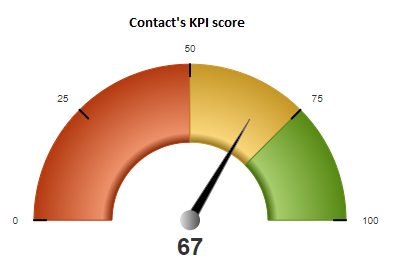
A KPI chart is an angular gauge type in Self-Service Publisher that displays the KPI results based on contract threshold. It enables you to view and analyze the contract 'performance'. An example of KPI chart is given below:

In the above image, 0, 25, 50, 75 and 100 are threshold values. The KPI value is 67, in the yellow area. This represents a reasonable, but still insufficient performance of the contract.